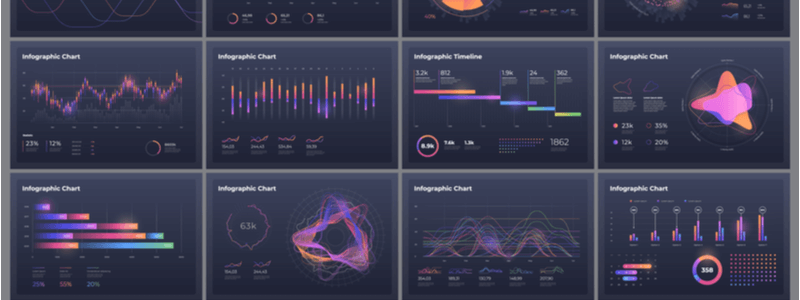
Data visualization is a method of transforming, or rather translating information into a visual representation. This representation could be in the form of maps, graphs, charts, etc. One of the fundamental objectives of data visualization is to make the life of decision-makers easier, by identifying patterns, trends and even getting better visibility.
Data visualization has been in existence for quite a long time. Earlier, it was all done through graphs and charts that were manually prepared using excel spreadsheets (which is still used by many companies). With the advent of Business Intelligence, there have been many off-the-shelf tools to help organizations achieve their objective around data visualization.
When it comes to internal objectives or presentations, companies usually prefer to have a static visual representation of data. However, today companies also have started adopting interactive visualizations.
For instance, companies today use BI tools to create interactive dashboards that deliver key metrics and KPIs that can help them to take decisions easily and instantly.
What is Data Analytics?
Data analytics brings in the intelligence quotient whereby it not only takes care of the visual representation, but it gives you a comprehensive view of where you were, where you are and where will you be.
Conceptually, the data analytics process has multiple components. The process itself involves combining these components to successfully analyze data and come up with a clear understanding of where the organization was in the past. It also gives a current standing of the organization and helps in predicting the position of the organization in the future.
From a classification point of view, there are four types of data analytics – descriptive, diagnostic, predictive, and prescriptive analytics. Each of these types of data analytics has a specific objective associated with them. Moreover, these different types play different roles in various places of the data analytics process.
Descriptive analytics helps in getting a perspective of what happened in the organization. This is usually performed using a large quantum of data.
Diagnostic analytics gives organizations an answer to questions related to why something happened. The diagnostic process supplements the descriptive methodology.
Predictive analytics will give organizations insight into what will happen in the future.
Prescriptive analytics supports predictive analytics by suggesting remedial measures in case of any deviation or adversities.
Difference Between Data Visualization and Data Analytics
| Data Visualization | Data Analytics |
|---|---|
| From a definition point of view, this is a purely visual representation of all data to give better clarity to the viewers. | Data analytics is the process of completely scrutinizing the data across the organization and making meaningful interpretations for decision making. |
| Data visualization may or may not require a specialized software | Data analytics does require specialized software as it requires artificial intelligence or machine learning technology |
| This does the primary task of identifying areas of improvement or those that need immediate attention | Here, it does the task of identifying patterns and trends |
| Provides clarity that significantly influences customer behavior | Data analytics serves as an input for data visualization |
| The objective of data visualization is to communicate the information clearly | Data analytics helps organizations to make informed decisions by slicing and dicing the data |
| It helps in developing a better perception | Data analytics in tandem with data visualization helps in drawing conclusions |
| Data visualization is primarily used in sectors such as Banking, Financial Services, and Retail | Data analytics technologies and methodologies are majorly used in Healthcare, Crime Detection, Travel, Commercial, and Finance domains |
| The techniques or methodologies of data visualization are either static or interactive in nature | Data analytics methodologies are either predictive analytics or prescriptive analytics |
Conclusion
Data visualization and data analytics though used in silos can be used effectively by organizations in tandem to run efficient analytics and intelligence projects. This will help organizations get complete clarity on the performance across the board.